
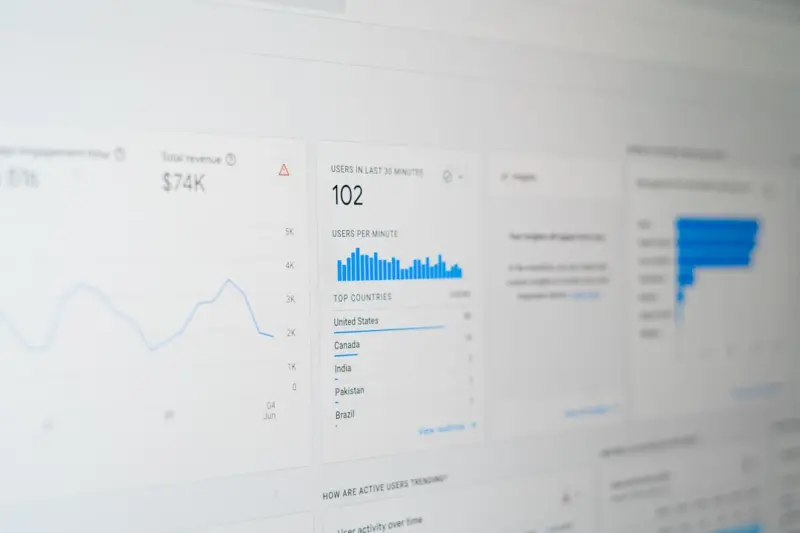
When you manage a brand that lives in dozens—or even hundreds—of neighborhoods, the old “check the rankings” habit just doesn’t cut it. You need a cockpit that surfaces the health of each location in real time, highlights the tiny shifts that matter, and feeds those insights straight into the teams that can act on them. In other words, you need a real‑time local SEO dashboard.
Why “Static” Reporting Is Killing Your Local Growth
Most local SEO reports still look like a snapshot from a decade ago: a PDF with a list of keyword positions, a handful of citation scores, and a vague “overall rating” that never changes until the next monthly meeting. That approach assumes two things that are rarely true today:
- Local search intent is static. In reality, search intent morphs by the hour as weather, events, and even traffic patterns shift.
- One size fits all. Each storefront has a unique audience, competition set, and set of local signals.
When you rely on static data, you’re reacting to problems after they’ve already cost you foot traffic, phone calls, or online orders. A real‑time dashboard flips the script: it turns data into a proactive, location‑specific playbook.
The Core Pillars of a Real‑Time Local SEO Dashboard
Building a dashboard that actually drives results means focusing on four pillars:
1. Visibility & Ranking Heatmaps
Instead of a single list of rankings, map keyword performance onto a geographic heatmap. Color‑coded pins show where you dominate “near me” searches and where you’re slipping. Layer in the “near me” filters that Google now favors and you’ll see opportunities to tweak titles, meta descriptions, or schema to capture that extra click.
2. Citation Health & Consistency Scores
Every NAP (Name, Address, Phone) mismatch is a tiny leak in your local authority. Pull data from major directories (Google Business Profile, Bing Places, Apple Maps, Yelp, etc.) and calculate a consistency score per location. The dashboard should alert you the moment a change occurs—say, a franchisee updates a phone number on their website but forgets to sync it on Yelp.
3. Review Velocity & Sentiment Tracking
Reviews are the social proof that fuels local click‑through rates. Track not just the aggregate rating but the velocity of new reviews, the average response time, and sentiment trends. A sudden dip in sentiment can be a leading indicator of service issues that, if addressed quickly, protect both your brand reputation and your rankings.
4. Engagement & Conversion Signals
Local SEO is no longer about clicks alone. Use Google Business Profile insights, call‑tracking numbers, and click‑to‑message data to see which locations are turning searches into actions. Pair that with foot‑traffic data from Wi‑Fi analytics or mobile device pings to close the loop on “did the search lead to a visit?”
Data Sources You Can’t Afford to Miss
To feed these pillars, pull from a mix of native platforms and third‑party tools:
- Google Business Profile API for real‑time insights on searches, views, and actions.
- Schema.org markup validation tools to ensure each page’s local structured data is being read correctly by crawlers.
- Review aggregation services (e.g., Trustpilot, Yotpo) that provide webhook notifications for new reviews.
- Location‑specific analytics like Google Analytics’ “Geo” reports and custom events for phone clicks.
- Third‑party citation monitoring platforms that crawl directories for NAP consistency.
When you bring these streams together in a single UI, the result is a live pulse of your brand’s local health.
Designing the Dashboard: From Data to Action
Data is only as good as the actions it inspires. Here’s how to structure the UI for maximum impact:
Executive Overview Tab
A single page that shows overall health scores, top‑performing locations, and any red‑flag alerts. Think of it as the “flight dashboard” for senior leadership—quick, glanceable, and decision‑ready.
Location Detail Tabs
Click a pin on the heatmap to drill down. Each location page should surface:
- Current ranking trends for core keywords.
- Citation health meter.
- Review sentiment timeline.
- Conversion funnel metrics (search → click → call/message → visit).
Include a “next steps” widget that automatically suggests actions (e.g., “Update NAP on Yelp” or “Respond to 2‑star review”).
Opportunity Finder
Using AI‑driven clustering, surface keywords where you rank on page 2 but have high search volume. Pair that with a “content gap” indicator that tells you if you’re missing a local landing page or schema markup.
Alert Engine
Set thresholds for each metric—e.g., a drop of 15 % in citation consistency or a surge in negative reviews. When thresholds are crossed, push notifications to the appropriate stakeholder via Slack, email, or mobile push.
Integrating the Dashboard With Existing Workflows
A dashboard that lives in isolation quickly becomes a novelty. To embed it in your day‑to‑day processes, connect it to the tools your teams already use:
- Project Management: Auto‑create tasks in Asana or Jira when alerts fire.
- CRM: Sync high‑intent search data to sales pipelines, so reps can follow up on “call‑now” clicks.
- Marketing Automation: Trigger localized email or SMS campaigns when a location’s review sentiment spikes positively.
This integration turns raw data into a workflow engine that continuously optimizes each storefront’s visibility.
Case Study Snapshot: Turning Data Into Foot Traffic
One regional coffee chain with 45 locations rolled out a custom dashboard built on the principles above. Within three months they saw:
- 15 % increase in “near me” clicks across the network.
- 25 % reduction in citation errors after automated alerts.
- Average rating lift from 3.8 to 4.3 stars, driven by rapid review responses.
- 10 % rise in in‑store sales attributed to localized promotion triggers.
The secret? Real‑time visibility gave franchisees the confidence to make micro‑optimizations—like adding “open now” schema on windy days—without waiting for a quarterly audit.
Getting Started: A 5‑Step Playbook
- Map Your Data Landscape. List every platform that holds local signals for your brand. Prioritize those with APIs or reliable export options.
- Choose a Visualization Tool. Whether it’s Google Data Studio, Tableau, or a bespoke React app, ensure it can handle geo‑visualization and real‑time updates.
- Build the Core Metrics. Start with visibility heatmaps, citation health, and review sentiment. Add engagement metrics once the foundation is stable.
- Set Alert Thresholds. Use historical data to define what constitutes a “significant” change. Begin conservatively; you can tighten thresholds over time.
- Close the Loop. Integrate with task‑management and CRM tools so that every alert results in an assigned action.
Leveraging Existing Knowledge Assets
If you’ve already built local content hubs or experimented with voice‑first optimization, the dashboard becomes the command center for those efforts. For instance, the Hyperlocal Content Hub Playbook provides a library of location‑specific landing pages. Your dashboard can surface which hubs are under‑performing and automatically suggest new keyword targets.
Similarly, if you’ve dabbled in Voice‑First Local SEO, the real‑time dashboard can track how many “near me” voice queries each store captures, letting you fine‑tune schema and conversational content on the fly.
Future‑Proofing Your Dashboard
Local search is evolving—think augmented reality storefronts and hyper‑personalized “near you” ads. A well‑architected dashboard should be modular, allowing you to plug in new data sources as they emerge. Consider these forward‑looking integrations:
- AR Mapping APIs: Track foot traffic generated from AR storefront overlays.
- Edge‑Delivered SEO Signals: Pull performance data from CDN edge nodes to understand regional latency impacts on rankings. (Read more about Edge SEO for technical insights.)
- Privacy‑First Location Signals: With increasing data protection regulations, incorporate consent‑driven geolocation data to stay compliant.
Wrapping It Up
In a world where the next consumer might be five blocks away, “set it and forget it” local SEO is a relic. A real‑time dashboard equips you with the clarity, speed, and accountability you need to dominate every neighborhood you serve. By turning raw signals into actionable insights—and wiring those insights into the everyday workflows of your teams—you’ll not only climb the rankings but also drive tangible foot traffic and revenue growth.
Ready to move from static snapshots to a living, breathing local SEO control center? Start mapping your data today, and watch each location’s performance transform from a mystery into a measurable, improvable engine of growth.

Becky Putman is an Ottawa-based freelance writer and marketing professional with a passion for storytelling, animals, and community involvement. She enjoys creating engaging content that informs, inspires, and connects with readers.
Related Posts

The Hyperlocal Content Hub Playbook: Dominate Neighborhood Search
Discover a fresh local SEO strategy: hyperlocal content hubs. By creating micro‑focused pages for ... Read More

Why Local SEO Needs a Human‑Centric, Mobile‑First Makeover
A human‑centric, mobile‑first strategy is the secret sauce for local SEO success—learn how emp... Read More

Neighborhood Partnerships: The Untapped Engine Driving Hyper‑Local SEO
Learn why teaming up with neighboring shops creates a powerful SEO network, turning local citations ... Read More
Top Posts

Link Magnets: How Interactive Tools Supercharge SaaS Link Building
Interactive tools like calculators, dashboards, and free APIs become natural link magnets. This post outlines a step‑by‑step playbook for SaaS brands to cre...Read More
When AI Takes Over the SERP: Strategies for the New Generation of Search Results
The SERP is evolving into an AI‑powered conversational partner. This post breaks down the three pillars—structured data, promptability, and authority—that...Read More

Local SEO for SaaS: Turning Neighborhood Signals into Qualified Leads
Discover a step‑by‑step guide for SaaS businesses to harness local SEO, from audit basics and city‑specific content to community‑driven link building an...Read More

Turning Mobile Deep Links into SaaS Growth Engines
Deep linking guides mobile users straight to the exact in‑product feature they need, improving relevance, reducing bounce rates, and unlocking new SEO opportu...Read More
0 Comments
Post Comment
You will need to Login or Register to comment on this post!